市場価格予測におけるバックテストについてはPythonのツールも多く出ており、本ブログでも何回か取り上げています。今回はvectorbtライブラリに関してです。いつも通り、Medium英文記事をベースとしています。vectorbtライブラリはベクトル並列計算などを用いて高速でバックテストやパラメータのチューニングが行えるライブラリです。ごく最近リリースされたものではありませんが、ネット上でのチュートリアルや解説記事はあまり多くありません。実用という所とは少し外れているからかもしれませんが、試してみる価値はあります。使い方もかなり込み入っています。本ブログでも原記事のコードをほぼ踏襲しています。
まず、必要なライブラリをインポートします。
import numpy as np
import pandas as pd
import yfinance as yf
import vectorbt as vbt
import seaborn as sns
import matplotlib.pyplot as plt
from datetime import date, datetime, timedelta
import warnings
warnings.simplefilter(action="ignore", category=FutureWarning)
原記事では、シグナル判定にChande Momentum Oscillator (CMO)とTrix Indicatorを用いていますが、以下はそれらの指標の計算関数です。
# Chande Momentum Oscillator (CMO)
def chande_momentum_oscillator(df, period=14):
    df['CMO'] = ((df['Close'] - df['Close'].shift(period)).rolling(window=period).sum()) / \
                ((df['Close'] - df['Close'].shift(1)).abs().rolling(window=period).sum()) * 100
    return df['CMO']

# Trix Indicator
def trix(df, period=14):
    df['Trix'] = df['Close'].ewm(span=period, min_periods=period).mean()
    df['Trix_Signal'] = df['Trix'].ewm(span=period, min_periods=period).mean()
    return df['Trix'], df['Trix_Signal']
次に、株価データを読み込みます。
ticker = '9432.T'
end_date = datetime.today()
start_date = end_date - timedelta(days=730)
df = yf.download(ticker, start_date, end_date)
df.columns = [col[0] if isinstance(col, tuple) else col for col in df.columns]
次に、指標のパラメータを引数として、トータルリターンを返り値とする関数を定義します。ここで参入と退出の戦略を定め、vectorbtライブラリでポートフォリオを計算しています。
# Function to calculate portfolio performance
def calculate_performance(cmo_period, trix_period):
    # Calculate CMO and Trix for each period
    df['CMO'] = chande_momentum_oscillator(df, cmo_period)
    df['Trix'], df['Trix_Signal'] = trix(df, trix_period)

    # Define entry and exit signals based on CMO and Trix
    df['Entry'] = (
        (df['CMO'] > 0) &  # CMO crosses above 0
        (df['Trix'] > df['Trix_Signal'])   # Trix crosses above Trix Signal line
    )

    df['Exit'] = (
        (df['CMO'] < 0) &  # CMO crosses below 0
        (df['Trix'] < df['Trix_Signal'])   # Trix crosses below Trix Signal line
    )

    # Filter data for test only
    df_filtered = df[(df.index.year >= 2020) & (df.index.year <= 2025)]

    # Convert signals to boolean arrays
    entries = df_filtered['Entry'].to_numpy()
    exits = df_filtered['Exit'].to_numpy()

    # Backtest using vectorbt
    portfolio = vbt.Portfolio.from_signals(
        close=df_filtered['Close'],
        entries=entries,
        exits=exits,
        init_cash=100_000,
        fees=0.001
    )

    # Return total return as performance metric
    return portfolio.total_return()
次に、指定された範囲でパラメータ値を動かしてリターン最大のポイントを探索しています。
# Define the range of periods for optimization
cmo_period_range = range(1, 21)  # Example range for CMO period
trix_period_range = range(1, 21)  # Example range for Trix period

# Create an empty matrix to store the total returns for each combination of periods
total_returns_matrix = np.zeros((len(cmo_period_range), len(trix_period_range)))

# Loop over all combinations of periods and store the total returns
for i, cmo_period in enumerate(cmo_period_range):
    for j, trix_period in enumerate(trix_period_range):
        total_returns_matrix[i, j] = calculate_performance(cmo_period, trix_period)

# Find the best parameters based on the highest total return
best_cmo_period_idx, best_trix_period_idx = np.unravel_index(np.argmax(total_returns_matrix), total_returns_matrix.shape)
best_cmo_period = cmo_period_range[best_cmo_period_idx]
best_trix_period = trix_period_range[best_trix_period_idx]

print(f"Best CMO Period: {best_cmo_period}")
print(f"Best Trix Period: {best_trix_period}")
print(f"Best Total Return: {total_returns_matrix[best_cmo_period_idx, best_trix_period_idx]}")

そして、パラメータ探索のヒートマップを図示します。最も色の濃い場所が最適解です。
# Plot the heatmap of total returns
plt.figure(figsize=(10, 8))
sns.heatmap(total_returns_matrix, annot=False, cmap="YlGnBu", xticklabels=trix_period_range, yticklabels=cmo_period_range)
plt.title('Heatmap of Total Returns for CMO and Trix Periods')
plt.xlabel('Trix Period')
plt.ylabel('CMO Period')
plt.show()

次に、最適化されたパラメータ値を用いてバックテストを行っています。
# Now, calculate the portfolio using the best parameters
df['CMO'] = chande_momentum_oscillator(df, best_cmo_period)
df['Trix'], df['Trix_Signal'] = trix(df, best_trix_period)

# Define entry and exit signals
df['Entry'] = (
    (df['CMO'] > 0) &
    (df['Trix'] > df['Trix_Signal'])
)

df['Exit'] = (
    (df['CMO'] < 0) &
    (df['Trix'] < df['Trix_Signal'])
)

# Filter data for test only
df_filtered = df[(df.index.year >= 2020) & (df.index.year <= 2025)]

# Convert signals to boolean arrays
entries = df_filtered['Entry'].to_numpy()
exits = df_filtered['Exit'].to_numpy()

# Backtest using vectorbt
portfolio = vbt.Portfolio.from_signals(
    close=df_filtered['Close'],
    entries=entries,
    exits=exits,
    init_cash=100_000,
    fees=0.001,
    freq='d'
)

# Display performance metrics and plot
print(portfolio.stats(group_by=True))
portfolio.plot().show()
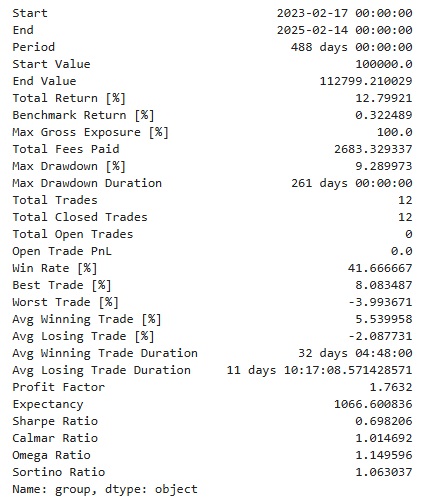
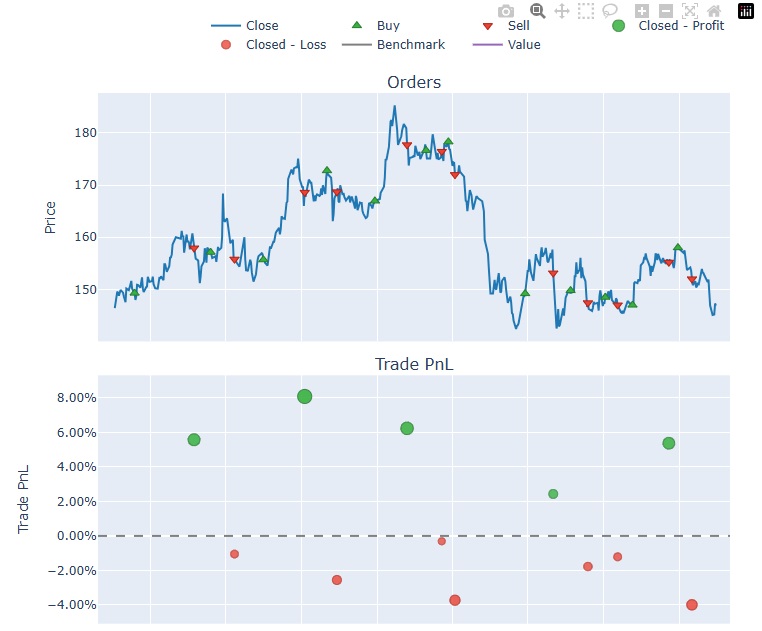

このように簡単なコマンドでバックテスト結果を図示することができます。